![]()
xfce4-cpugraph-plugin - CPU Load Indicator Graph Plugin
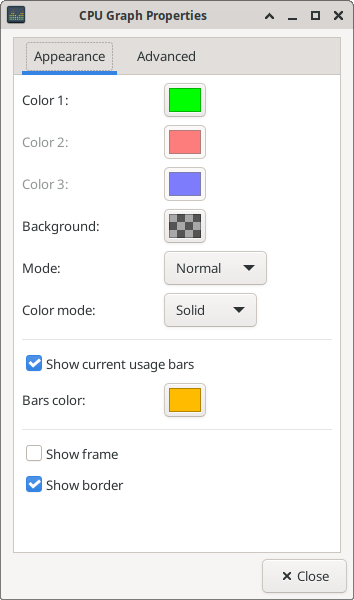
This panel plugin offers multiple display modes (LED, gradient, fire, etc…) to show the current CPU load of the system. Various appearance options, like colors or size, are customizable.
On multi core or multi CPU systems, CPU Graph can either track and display all of them at once, or at the user's option only a specific core or CPU.
Usage
- Right-click on the added plugin, select Properties to open the settings window.
Screenshots
| Examples of CPU Graph Panel Display Modes |
|---|


|
| CPU Graph Properties: Appearance Tab |
|---|

|
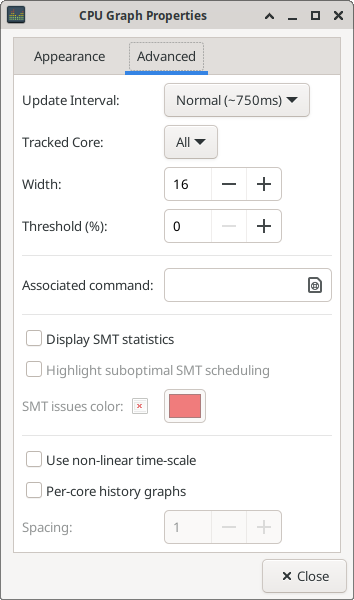
| CPU Graph Properties: Advanced Tab |
|---|

|
Highlighting of suboptimal thread placements
Starting with CPU Graph 1.2.0, it's possible to optionally highlight CPU usage bars corresponding to potentially suboptimal allocation of CPU cores to tasks on CPUs with SMT. The highlighting can be enabled via the “Highlight suboptimal SMT scheduling” checkbox.
On CPUs with SMT, CPU Graph automatically counts the number of SMT scheduling events (SMT scheduling incidents) that could have resulted in reduced performance of tasks running on the CPU. Detecting these events has a very low overhead and thus is enabled even if the “Highlight suboptimal SMT scheduling” checkbox is disabled. The number of SMT scheduling incidents and an estimate of how much they might have impacted performance is printed in the Stats tab in CPU Graph's Properties window.
In order to test this feature, run the following command-lines in a terminal window (adjusting numactl's CPU list according to your CPU topology if necessary):
$ numactl -C 0,1             perf stat stress-ng --cpu 2   # Optimal performance (IPC=1.6)
$ numactl -C 0,$[$(nproc)/2] perf stat stress-ng --cpu 2   # Suboptimal performance (IPC=1.21)
Latest Release
- xfce4-cpugraph-plugin 1.2.11 released (2024/12/25 08:27)
- Download current release (older versions of this component are also available here)
Source code repository
Reporting Bugs
- Reporting Bugs – List of currently open bugs and instructions on how to submit new bug reports